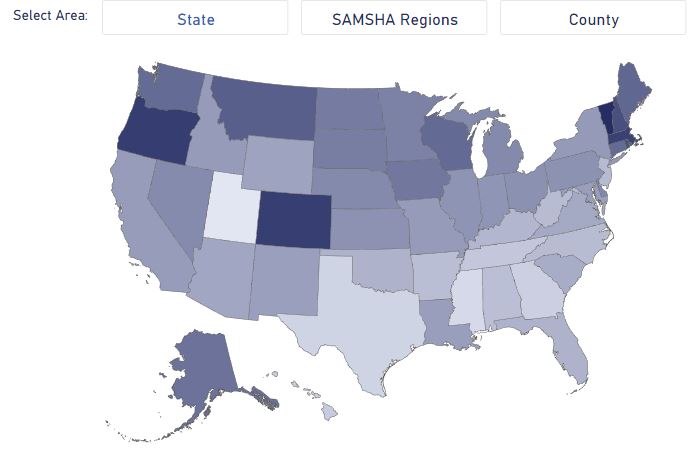
This map exhibits the number of BJA awards (407) that are actively providing funding in each state as of April 14, 2023. Start dates for these awards range from 2016 to 2022. Awards shown represent funding for Adult Treatment Courts, Veterans Treatment Courts, and Tribal Healing to Wellness Courts at both state and local levels. “Split funding” are awards that combined both Adult Treatment and Veterans Treatment Court funding.